
PharosFolio hero background
Logo PharosFolio®

PharosFolio - Free ETF Backtest simulator for European Investors

Quantitative Portfolio Management, In Your Hands.

PharosFolio® is designed to support advanced European investors in building, analyzing and managing diversified ETF/ETC portfolios autonomously, through a proprietary risk model and systematic rebalancing with adaptive allocation.
Every allocation is model-driven and presented through a clean, intuitive interface, for better-informed decisions.

Plan, rebalance and track your portfolio in one integrated workflow

See how PharosFolio adaptive rebalancing behaved in real market downturns

In the three crisis periods shown below, historical simulations showed lower drawdowns and faster recoveries for adaptive rebalancing (PharosFolio® risk level M) compared to a fixed 60/40 allocation.

What happened: Final phase of the dot-com bust (2000‑2002) combined with accounting scandals such as Enron and WorldCom eroded confidence in tech and corporate governance, dragging global equities lower while safe havens held up.
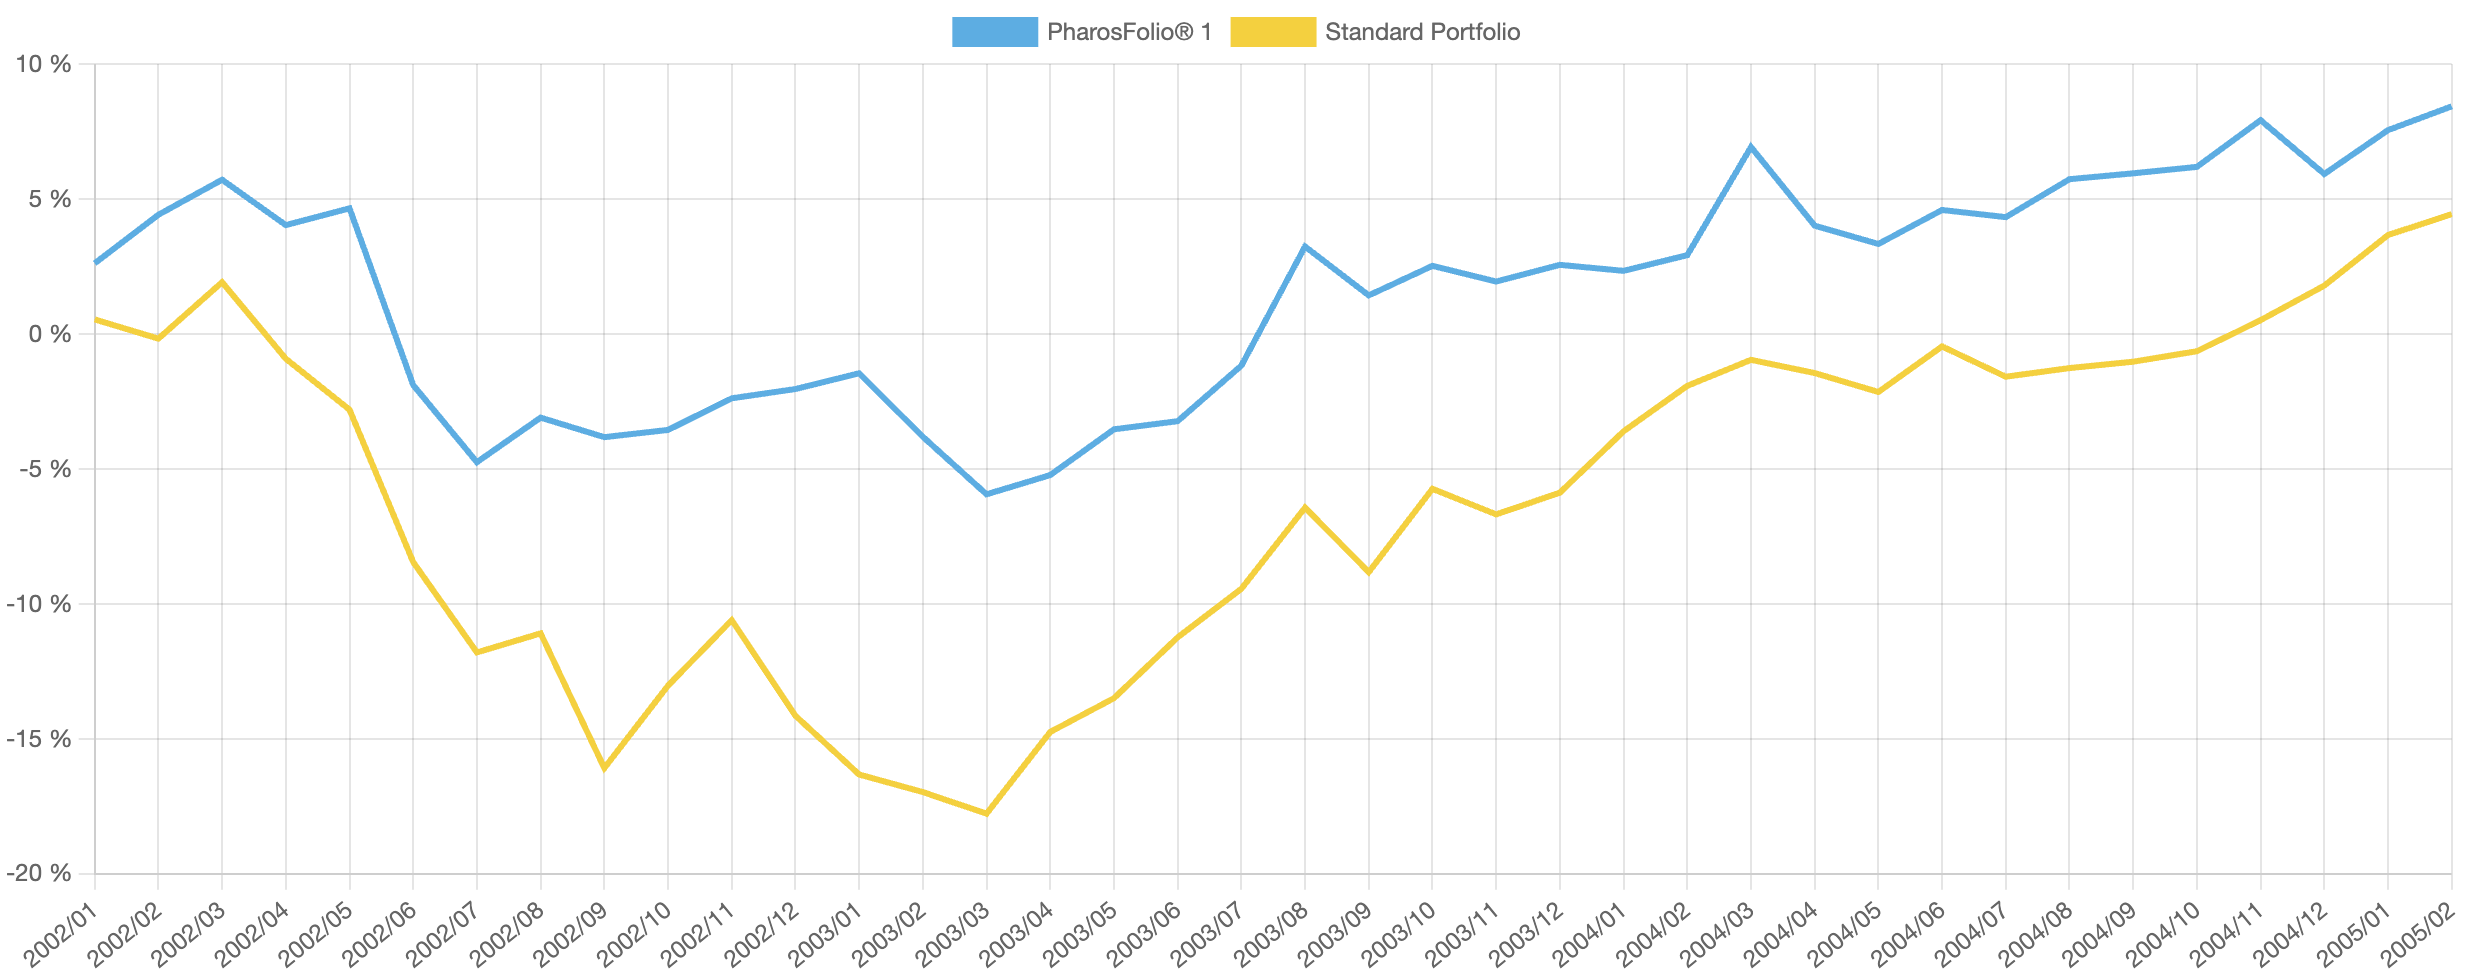
Performance During Dot-com Aftermath (2002-2005)
Performance comparison: PharosFolio® (risk level M) vs 60/40 during dot-com aftermath 2002-2005
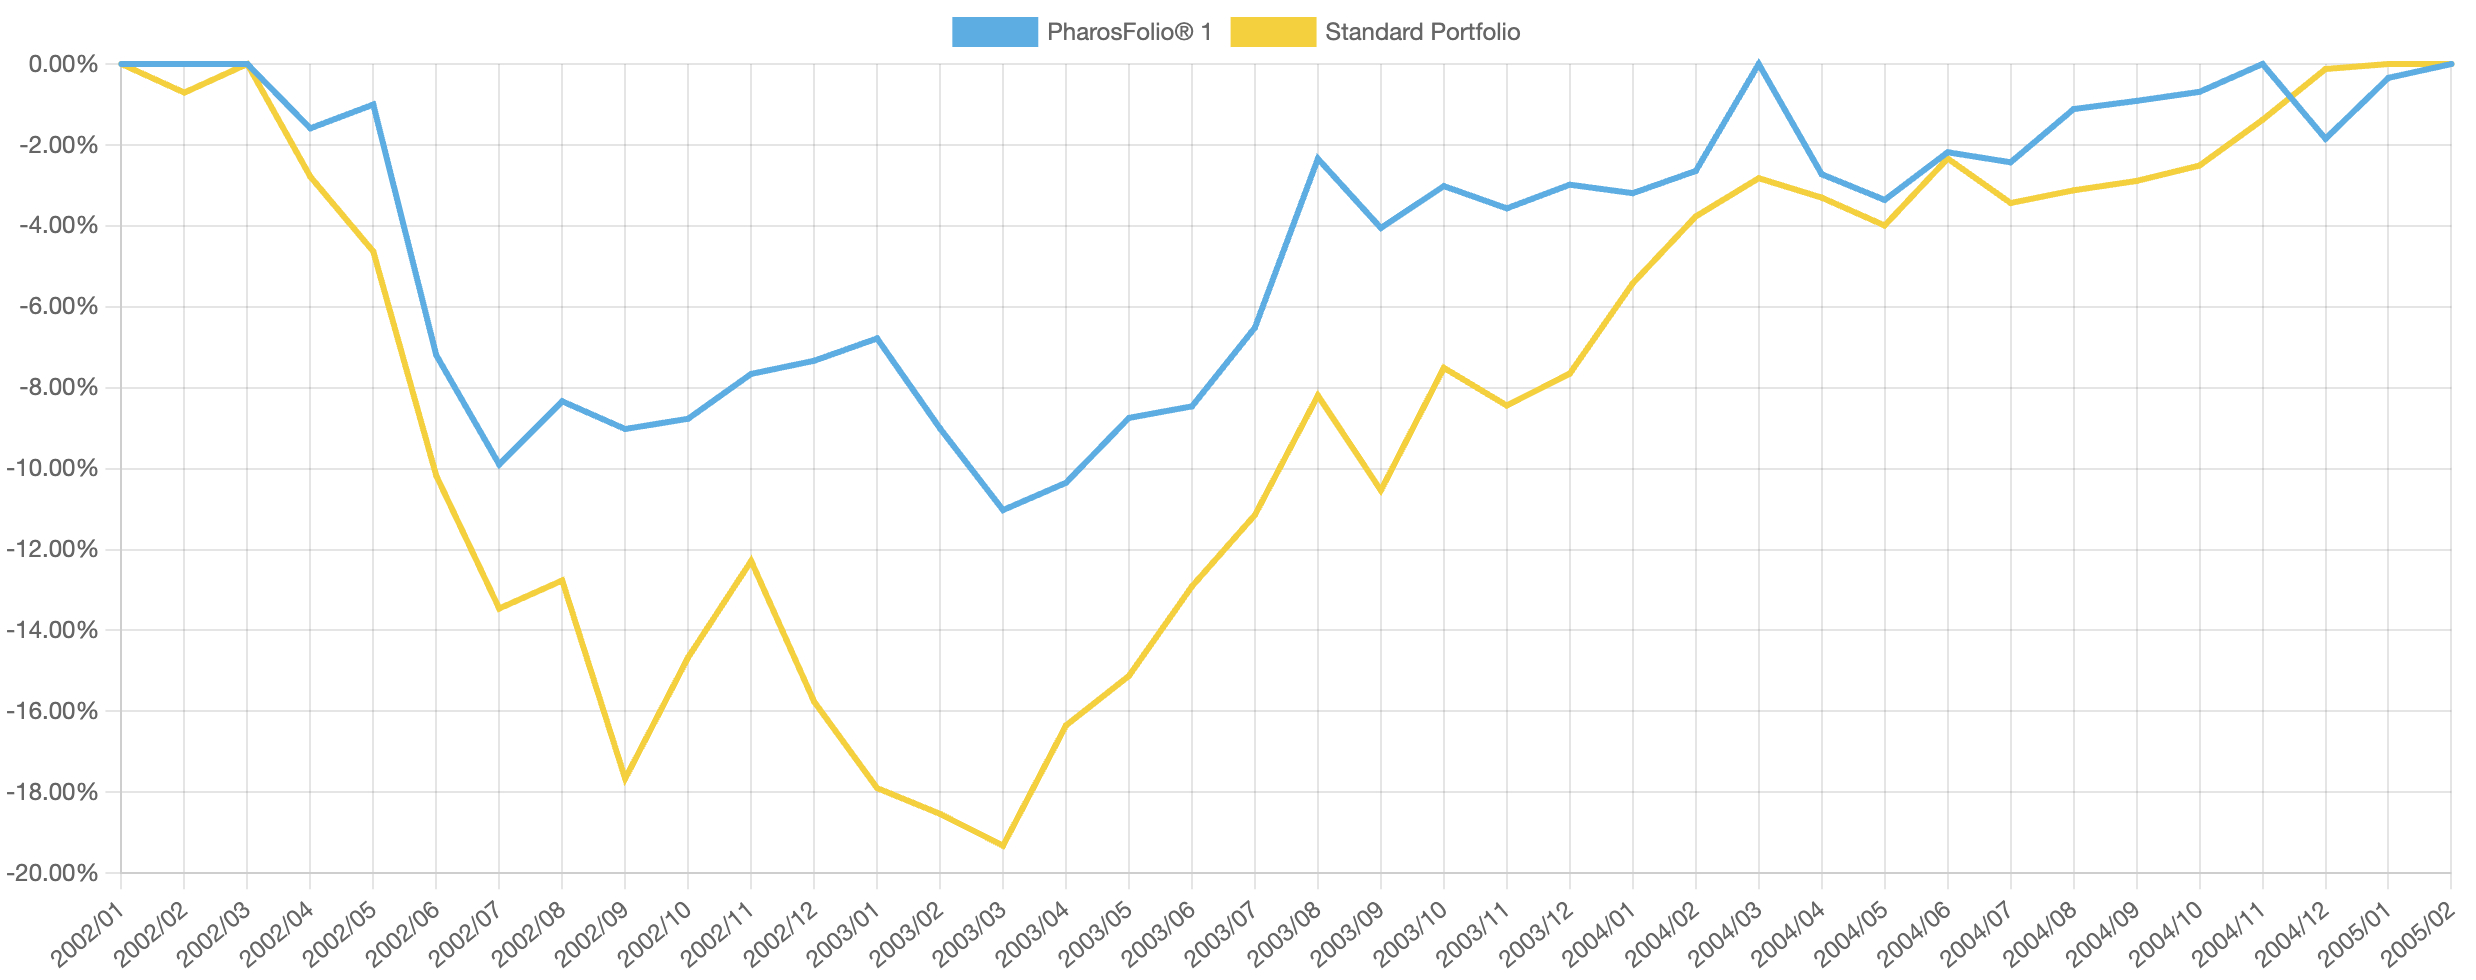
Drawdown Comparison
Drawdown comparison: PharosFolio® (risk level M) vs 60/40 during dot-com aftermath 2002-2005
Max Drawdown Recovery Time
PharosFolio® -8.93% 23 months
Standard 60/40 -19.32% 33 months

What happened: The global financial crisis triggered by U.S. subprime mortgages (2007‑2009) and the subsequent eurozone sovereign-debt stress (2010) caused deep drawdowns and a sluggish recovery for traditional allocations.
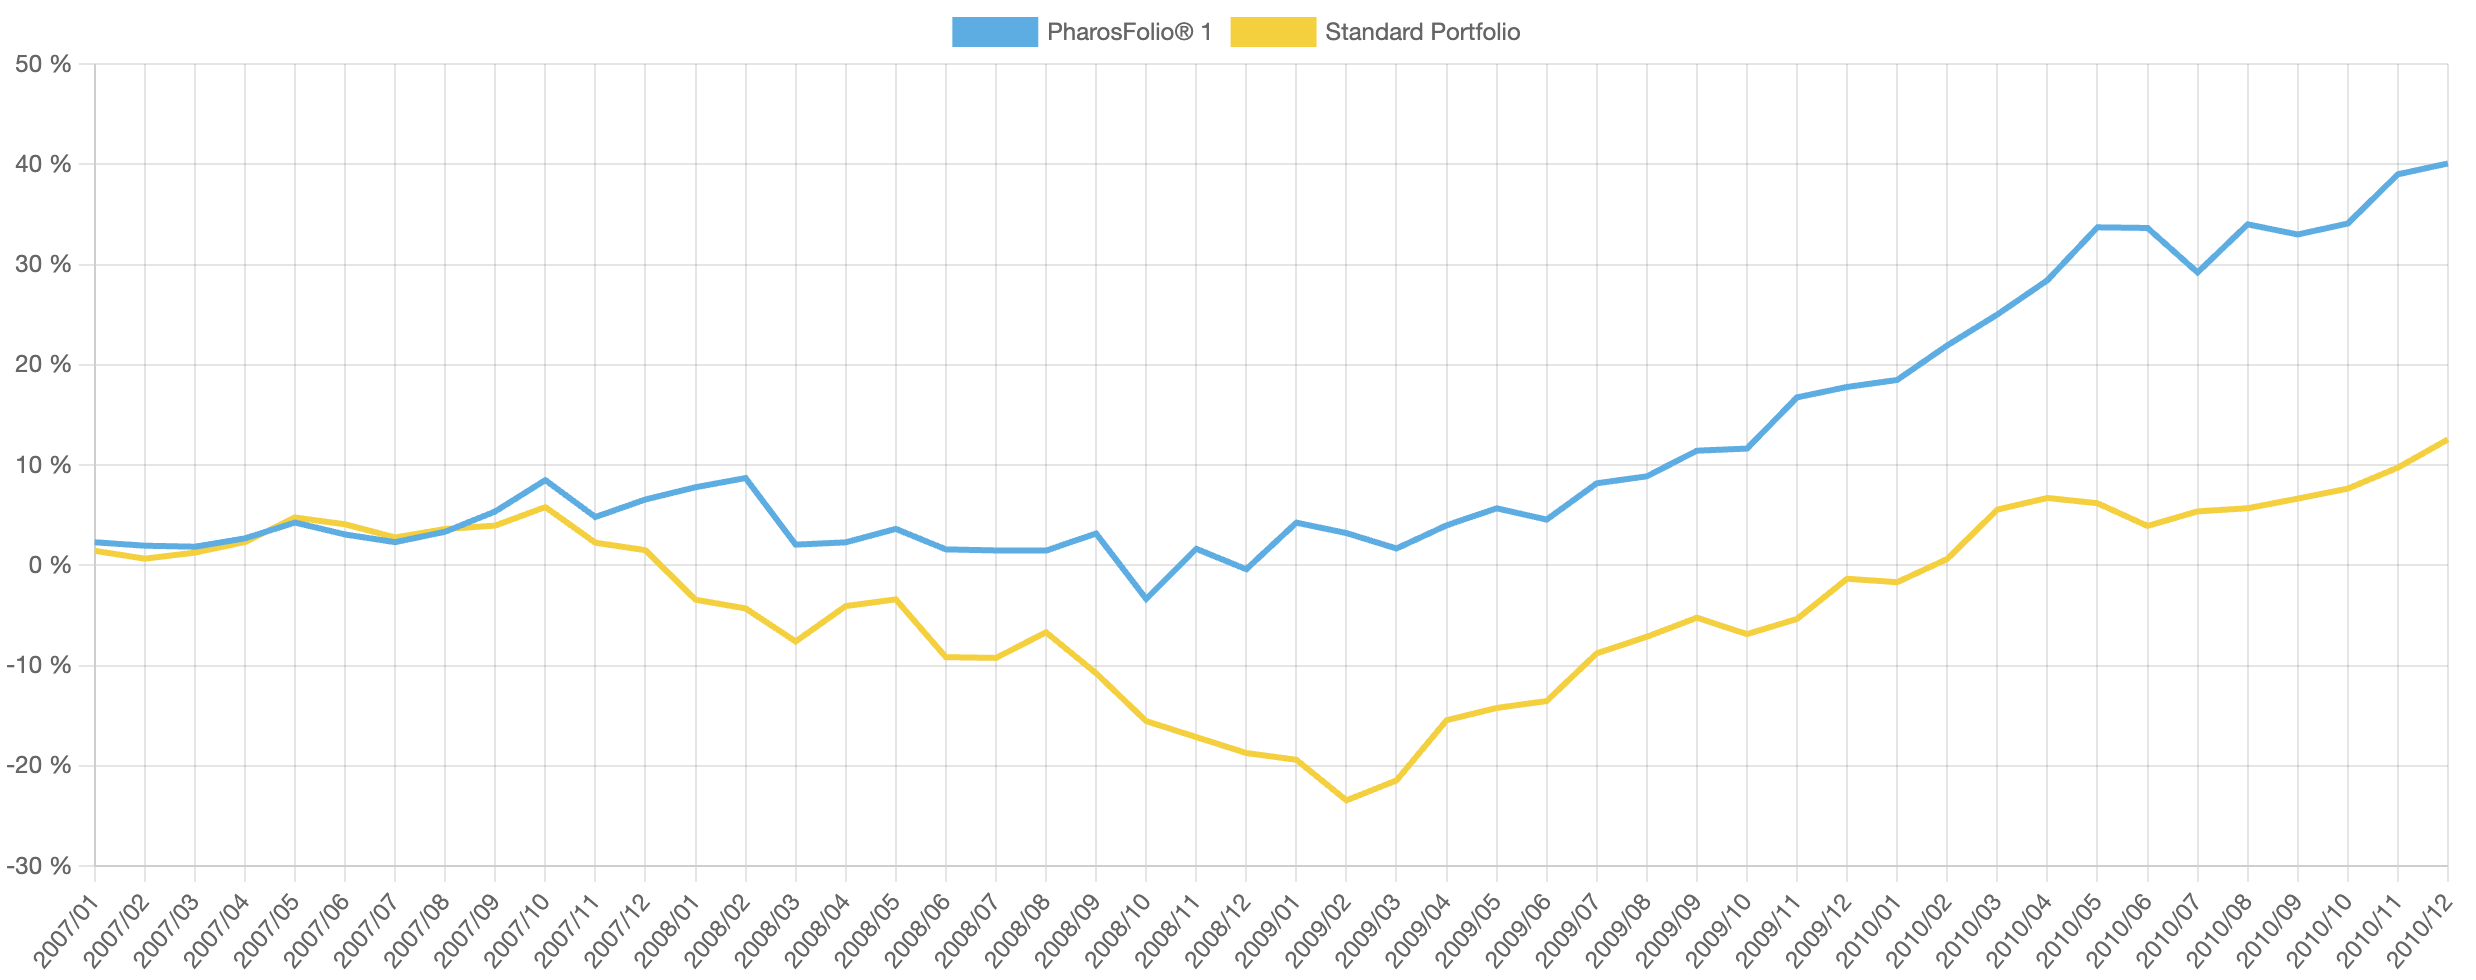
Performance During 2008 Crisis (2007-2010)
Performance comparison: PharosFolio® (risk level M) vs 60/40 during the 2008 financial crisis
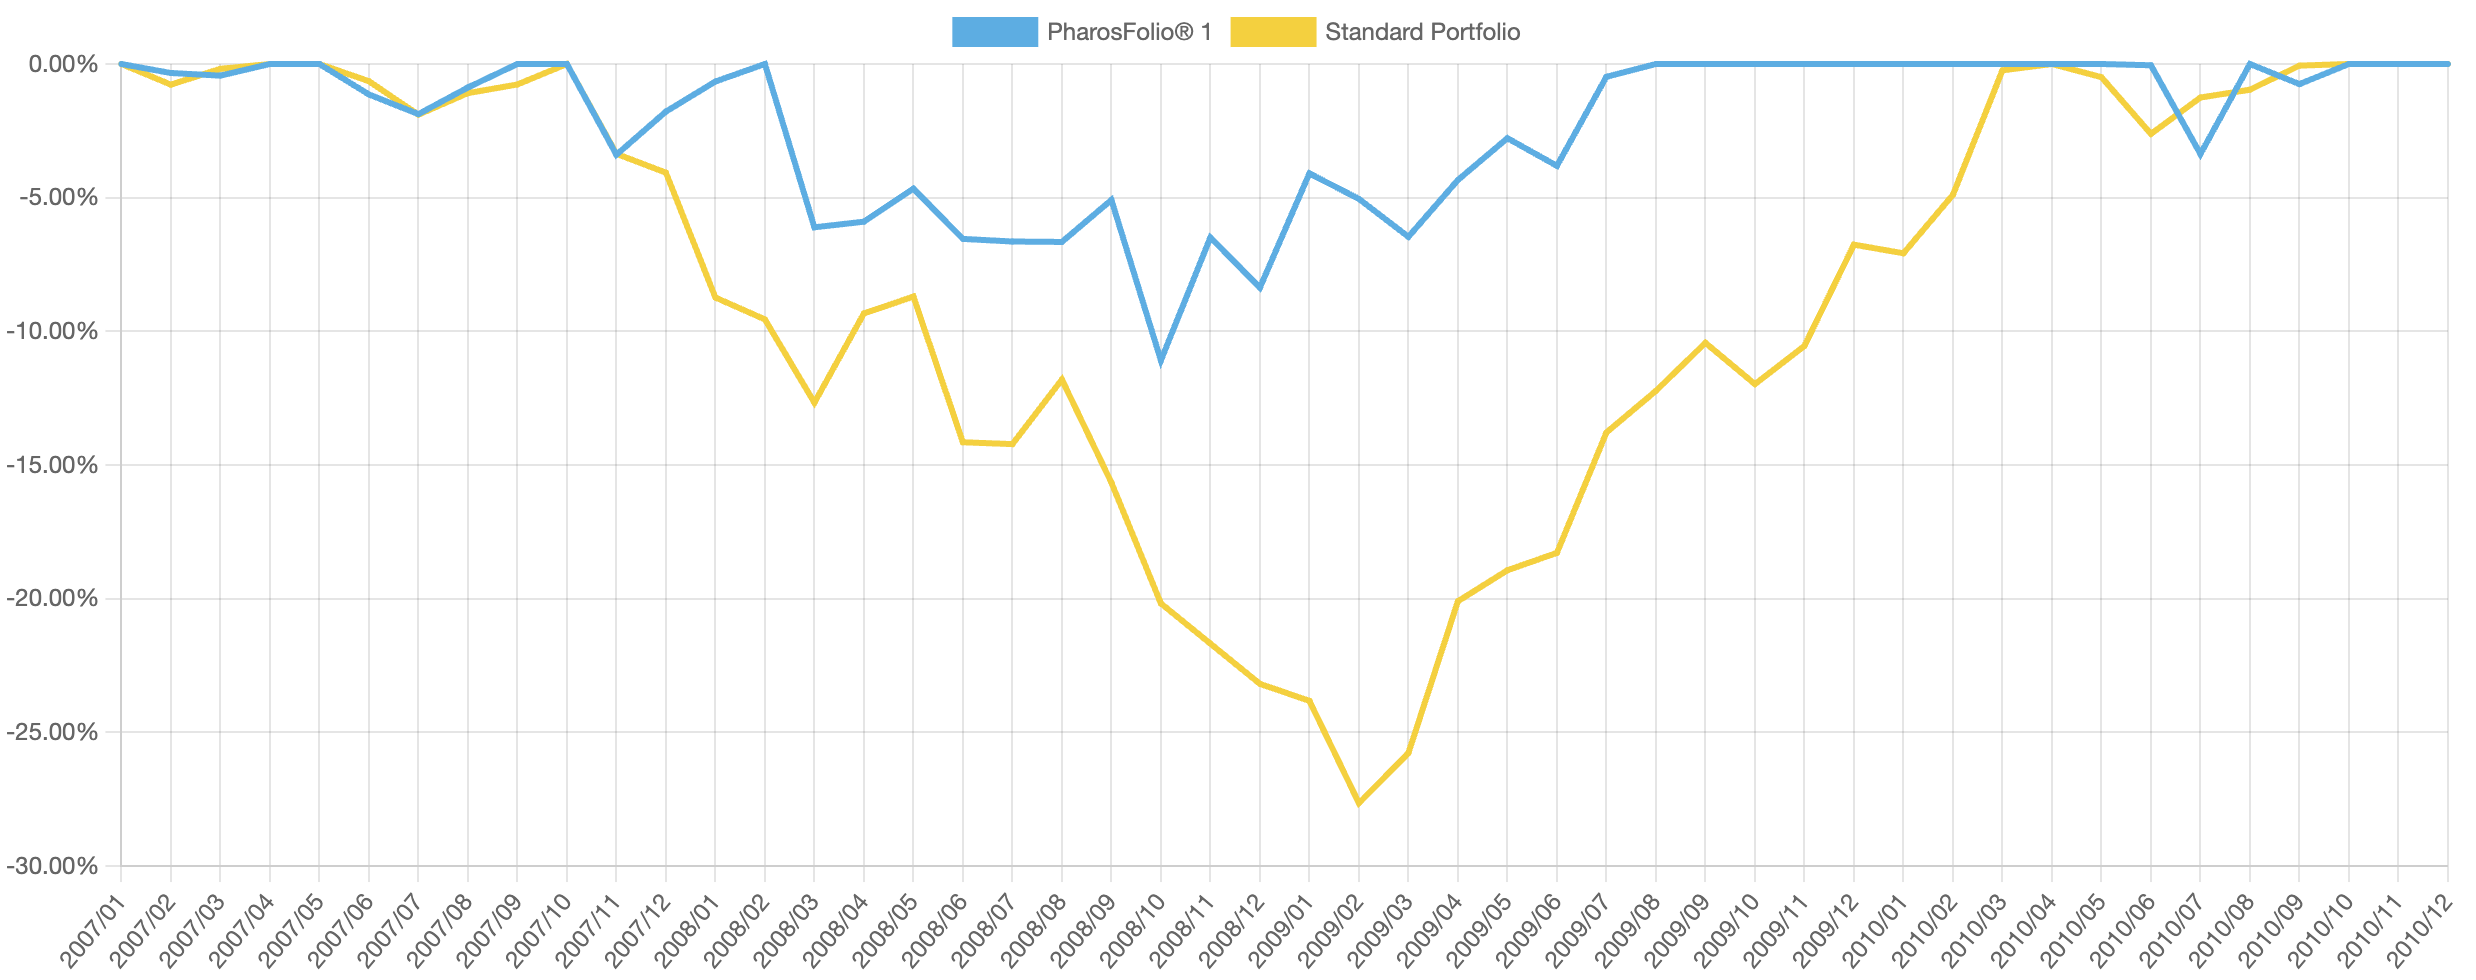
Drawdown Comparison
Drawdown comparison: PharosFolio® (risk level M) vs 60/40 during the 2008 financial crisis
Max Drawdown Recovery Time
PharosFolio® -10.26% 16 months
Standard 60/40 -27.65% 29 months

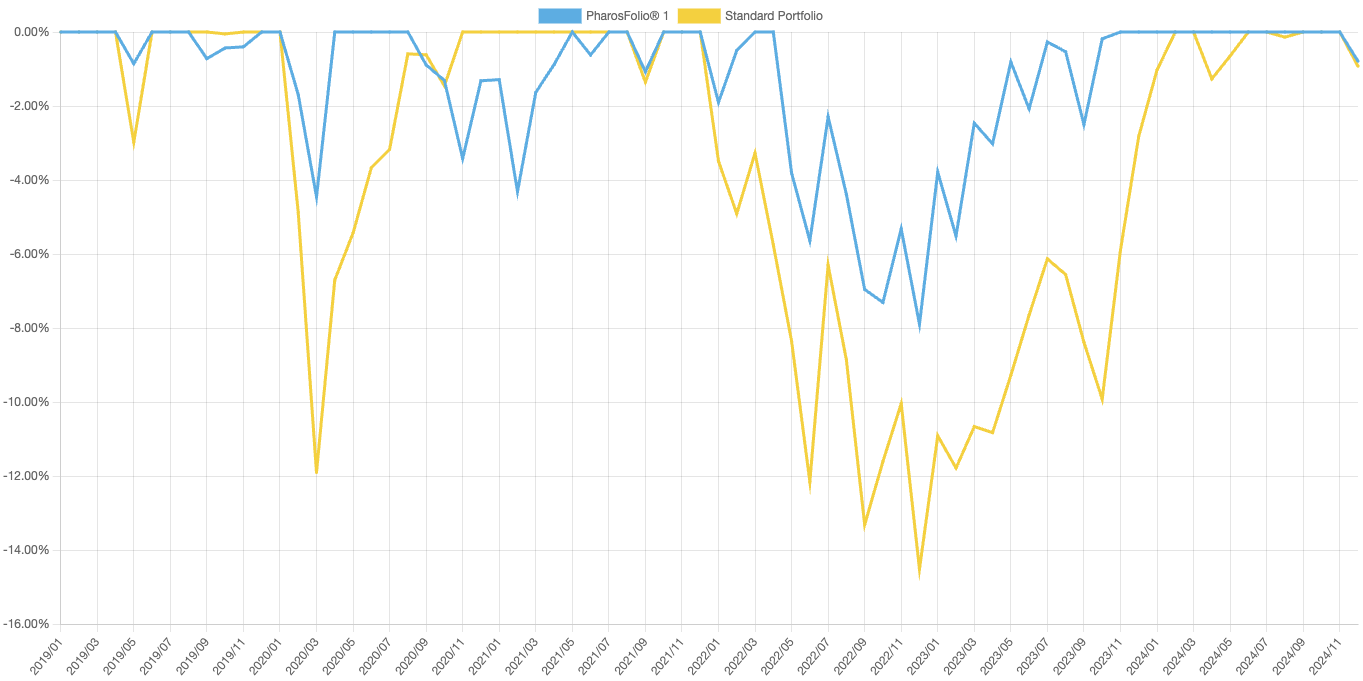
What happened: The COVID‑19 pandemic (2020) and the rapid interest-rate tightening cycle that followed (2022‑2023) produced two sharp shocks—first a historic crash, then volatility driven by inflation and rate hikes.
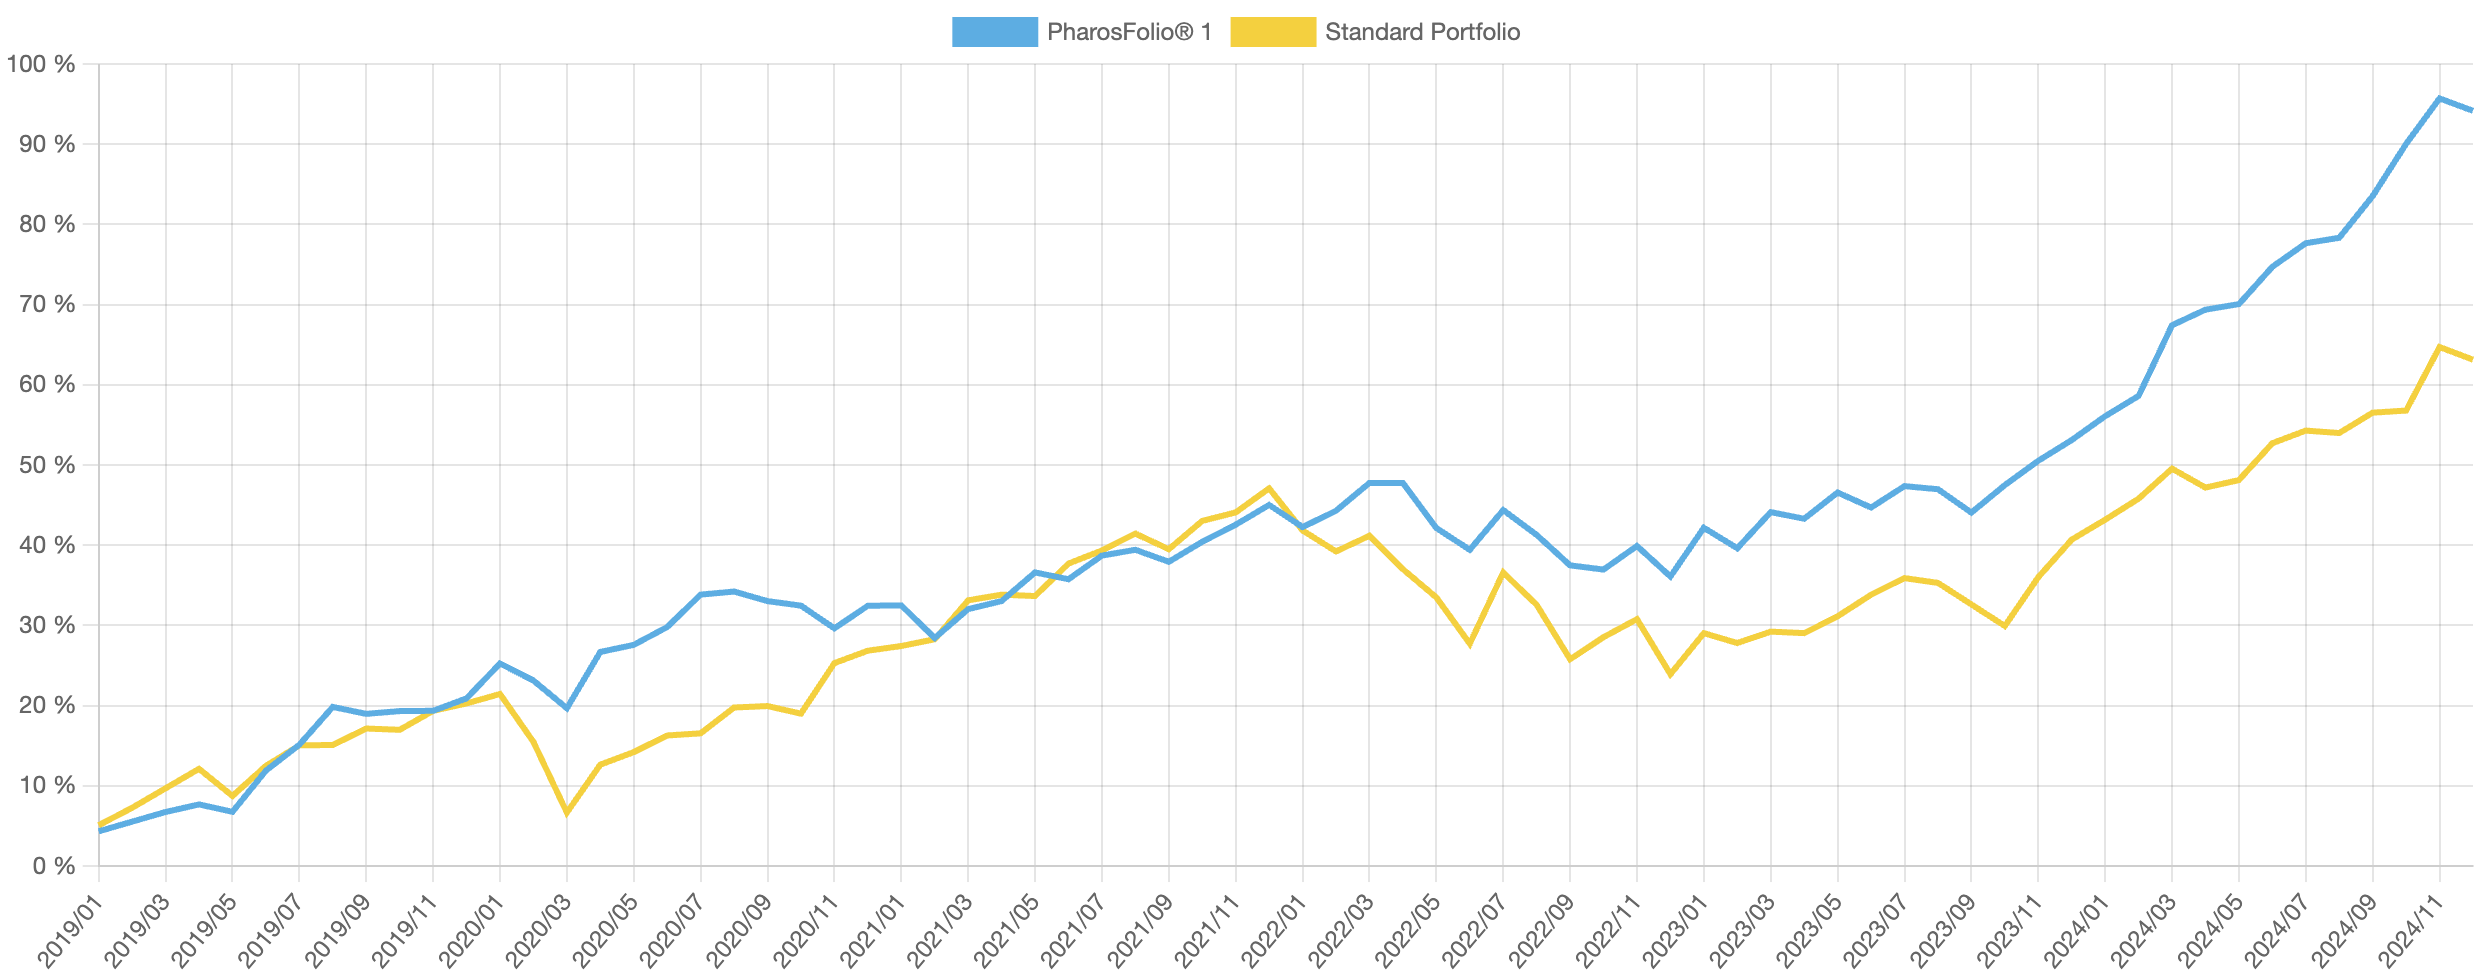
Performance During COVID + Rate Shock (2019-2024)
Performance comparison: PharosFolio® (risk level M) vs 60/40 during COVID + rate shock period
Drawdown Comparison
Drawdown comparison: PharosFolio® (risk level M) vs 60/40 during COVID + rate shock period
Max Drawdown Recovery Time
PharosFolio® -7.77% 17 months
Standard 60/40 -15.75% 26 months
Important: These simulations are based on historical data. Past performance does not guarantee future results.

globe--v1

Horizontal Diversification

Combines global equities, EU bonds, and gold to reduce volatility.

vertical-diversification

Vertical Diversification

Uses highly diversified ETFs and ETCs to replicate entire markets.

operational-efficiency

Adaptive Allocation

Target weights updated according to the latest market conditions at each rebalancing event.

low-cost-etf

Low-Cost ETFs & ETCs

Significantly lower management fees compared to active funds.

reduced-trading-costs

Reduced Trading Costs

Fewer transactions mean lower trading costs and taxes.

effortless-simplicity

Effortless Simplicity

A clean, intuitive interface that helps you align your portfolio decisions with your goals.